Build the total from executions
For trade , let be executed quantity and be for a buyer-initiated trade or for a seller-initiated trade. With zero immediately before the first included execution,
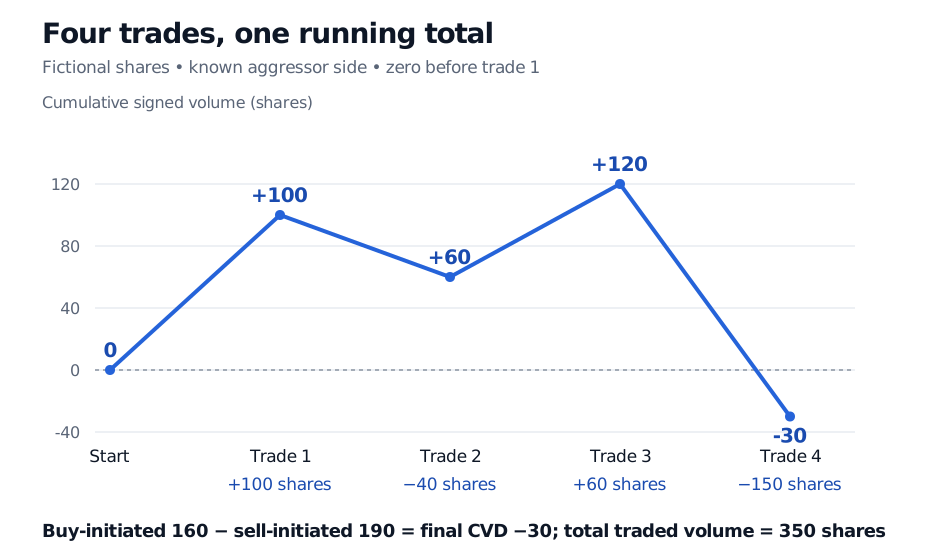
Consider four fictional trades in one stock, with known aggressor sides, no missing executions, no corrections and no reset during the example:
| Trade | Initiator | Quantity, shares | Signed contribution | CVD, shares |
|---|---|---|---|---|
| 1 | Buyer | 100 | +100 | 100 |
| 2 | Seller | 40 | −40 | 60 |
| 3 | Buyer | 60 | +60 | 120 |
| 4 | Seller | 150 | −150 | −30 |
Buyer-initiated volume is 160 shares, seller-initiated volume is 190, and total traded volume is 350. CVD ends at shares. The 350 counts each execution once, rather than separately counting its buyer and seller.
The sign is part of the measurement
A label reading “CVD” does not establish how a chart obtained its signs. Three approaches need different interpretations:
- Exchange-reported aggressor side. CME's documented Trade Summary LongQty field uses 1 for buy, 2 for sell and 0 for no aggressor. Its examples of no-aggressor trades include opening or resumed trading and certain implied-order interactions. Zero is not a sell sign. An analysis should retain no-aggressor and unavailable-side volume separately, stating whether it excludes them from signed volume or uses an explicit estimator. See the CME message specification.
- Trade-and-quote classification. Sierra Chart's volume study accumulates ask-volume minus bid-volume; its documentation describes a tick-based assignment for executions between the quotes. Those are classification rules, not observation of every trader's intent. See Sierra Chart's calculation method. More generally, tick and quote trade-classification rules depend on accurate event alignment.
- Lower-timeframe bar estimates. TradingView's documented indicator signs intrabar volume using price direction, with additional rules for unchanged intrabars, then accumulates it over an anchor period. Such a series estimates directional volume from bars; it does not identify each execution's aggressor. See TradingView's calculation and inputs.
Thus, two charts can disagree without either arithmetic sum being wrong. First compare the instrument and venue coverage, quantity units, classification method, filters, historical coverage and reset boundary.
A reset changes the question
A zero after a reset is a new baseline, not evidence that buying and selling have economically offset earlier activity. Record the timezone and trading-session definition as well as the timestamp. Missing feed intervals are missing observations, not known zero delta.
Corrections matter too. CME's specification distinguishes new, changed and deleted trades and supplies trade-entry identifiers. A reconstruction must apply changes to the relevant execution rather than treating every update as fresh volume. In the fictional example, if the final seller-initiated execution is subsequently cancelled, reversing its −150 contribution changes the corrected final CVD from −30 to 120. Live values and a later corrected history can therefore differ.
What a divergence can—and cannot—say
Price making a new low while CVD makes a higher low describes a mismatch between price and the measured signed-volume path. It does not prove passive absorption, reveal a hidden buyer or establish that price will reverse. Different displayed depth, quote revisions, venue coverage, sign errors and the chosen endpoints can all affect the comparison. An absorption hypothesis needs evidence of executions interacting with replenishing liquidity; the two plotted lines alone do not supply it.
Sources
- Sierra Chart — Cumulative Delta Bars - Volume: calculation method, historical data requirements and session-reset settings.
- CME Group — MDP 3.0 Trade Summary LongQty: aggressor-side values, no-aggressor cases, trade identifiers and update actions.
- TradingView — Cumulative Volume Delta: intrabar estimation and anchor-period resets.