The Federal Reserve dot plot shows the federal funds rate that each Federal Open Market Committee (FOMC) participant judges appropriate at each published horizon. It appears in the Fed’s quarterly Summary of Economic Projections (SEP) alongside projections for real GDP growth, unemployment and inflation. For a rates researcher, a new release shows how the distribution of those policy judgments has changed. The FOMC’s postmeeting statement gives the Committee’s actual policy decision. Fed guide to the SEP · Jerome Powell on FOMC communication
What a dot measures
Read one column at a time. Each dot gives one participant’s judgment of the appropriate midpoint of the federal funds target range, or the appropriate target level if expressed as a single rate. A calendar-year column refers to year-end. The separate longer-run column represents where a participant expects the rate to settle under appropriate policy in the absence of further shocks, with no fixed calendar date. The Fed plots each rate rounded to the nearest eighth of a percentage point. September 2026 SEP, Table 1 and Figure 2
Participants choose the policy they think would best support maximum employment and price stability given their economic outlook. Their GDP, unemployment and inflation projections in turn assume their own policy path. Changes in the outlook can therefore change what they judge appropriate. Submissions include Reserve Bank presidents who do not vote at that meeting. The dots are anonymous and carry no identifiers across columns, so connecting dots of the same rank across years can splice together different participants’ judgments. September 2026 SEP, overview and uncertainty discussion · Powell on what the dots disclose
Five dots for the same year-end
Suppose five participants in a fictional release submit 3.25%, 3.50%, 3.75%, 4.00% and 4.25% for the end of the next calendar year. The median is 3.75%, the third value when sorted. The lowest and highest dots are percentage point, or 100 basis points, apart. That spread measures disagreement across participants at this horizon. The number of dots at any rate counts submissions. Estimating the probability that the actual rate will fall inside that range is a separate forecasting problem. September 2026 SEP, median definition and uncertainty discussion
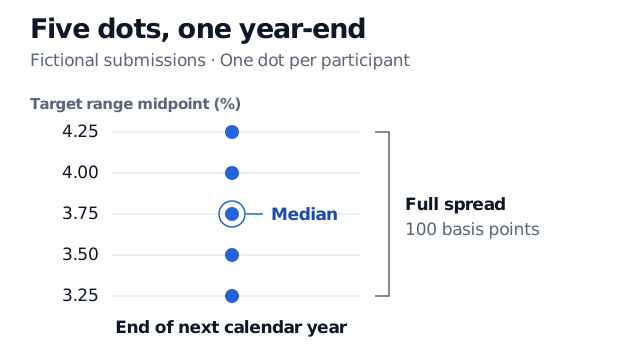
The median locates the middle submission. The full spread shows how far apart the outermost judgments are.
Put the dots beside market pricing
The SEP median summarises submitted year-end policy targets. A market-implied path is estimated from derivative prices and can move between SEP releases. For example, the Fed’s July 2026 Monetary Policy Report derives a path from quotes on overnight index swaps tied to the effective federal funds rate, using an explicit zero-term-premium assumption. The effective rate can differ from the target midpoint, and the contract may reference rates over a period while the dot refers to a single year-end. Before interpreting a gap, match the observation times and horizons, account for the effective-to-target difference and state the risk-premium assumption. Federal Reserve Monetary Policy Report, Figure 35 · Richard Clarida on markets and policy expectations
For a release study, keep the projected year-end separate from when the release became usable. The September 2026 SEP, for example, was released at 2 p.m. U.S. Eastern Daylight Time on September 16. An intraday backtest that gives those dots to a decision earlier that day introduces look-ahead bias. The Observation, Event and Availability Timestamps lesson (full lesson with membership) shows how to allow for publication, receipt and processing before a signal can use a release. September 2026 SEP release notice
Sources
- Federal Reserve Board, Guide to the Summary of Economic Projections
- Federal Reserve Board, September 2026 Summary of Economic Projections
- Federal Reserve Board, September 2026 SEP release notice
- Jerome Powell, discussion of “Language after Liftoff,” 2016
- Federal Reserve Board, July 2026 Monetary Policy Report, Figure 35
- Richard Clarida, “Models, Markets, and Monetary Policy,” 2019