Understand why sector averages cannot establish firm-level relationships, using an exact example of within-sector, between-sector and pooled slopes.
Ecological fallacy
The ecological fallacy is inferring an individual-level relationship from a relationship observed between groups without enough evidence to justify that transfer. A positive association between sectors' average exposure and average performance does not establish a positive exposure–performance relationship among the securities inside them. The error changes the unit of analysis while keeping the conclusion. Freedman’s account separates this problem from ordinary confounding.
Here, “individual” means the underlying observational unit: it could be a person, firm, loan or security. It need not mean a human being.
Four firms, three slopes
Consider four fictional firms in two sectors. Each firm has an exposure score x and an outcome score y, both in arbitrary fictional units. Every firm receives equal weight. These invented scores isolate the arithmetic; they are not returns, forecasts or market evidence.
Sector
Firm
Exposure score x
Outcome score y
A
A1
1
9
A
A2
2
8
B
B1
4
12
B
B2
5
11
Within sector A, increasing x from 1 to 2 accompanies a fall in y from 9 to 8. Sector B has the same pattern. Both within-sector slopes are −1.
Now replace each sector's two firms with its mean pair:
Sector
Mean exposure
Mean outcome
A
1.5
8.5
B
4.5
11.5
The slope between these two means is
4.5−1.511.5−8.5=+1.
The tempting conclusion, “higher-exposure firms have higher outcomes within their sectors,” has the opposite sign from the observed within-sector relationships.
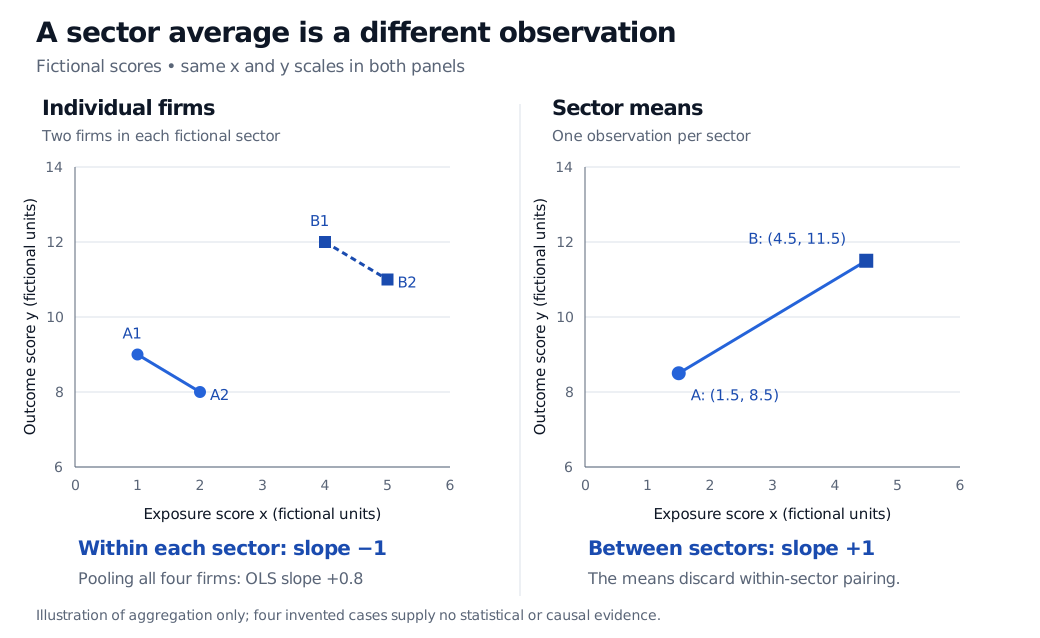
Four fictional firms: sector A has points (1,9) and (2,8); sector B has (4,12) and (5,11). Both within-sector slopes are minus 1. Sector means (1.5,8.5) and (4.5,11.5) have slope plus 1. Pooled individual OLS slope is plus 0.8.
Original fictional illustration, with matching axes. Sector means rise together even though the individual observations slope down within each sector. Circle and square markers distinguish sectors A and B.
There is a third comparison: fit ordinary least squares with an intercept to all four firms, ignoring sector. Its slope is
Thus between-sector slope +1, pooled firm-level slope +0.8 and within-sector slope −1 answer different questions. Even a regression whose rows are individual firms can mix within-sector and between-sector variation. The aggregate slope is not automatically the pooled individual slope, and neither is automatically a within-sector slope.
What the averages leave out
An aggregate dataset does not normally reveal which individual exposure goes with which individual outcome. To see the lost information, keep the same exposures but swap the outcomes inside each sector: assign A1 an outcome of 8, A2 an outcome of 9, B1 an outcome of 11 and B2 an outcome of 12.
Both sector means remain exactly unchanged. Yet the within-sector slopes are now +1, and the pooled slope is also +1. The same group means are compatible with different individual relationships. More groups or a very precise regression of group averages do not, by themselves, restore the missing pairing. Robinson's original analysis of ecological correlations, especially pp. 353–354, explains the corresponding loss of information for group percentages.
The first fictional dataset also exhibits a Simpson reversal: the within-sector slopes and pooled slope have opposite signs. Ecological fallacy names the unjustified inference across levels; Simpson paradox names a reversal in associations. An ecological fallacy can occur when signs agree but magnitudes or interpretations differ. A reversal is a warning, not a requirement.
Match the data to the claim
Before turning an aggregate pattern into a security-level model, specify what each row represents and what relationship you want to estimate. A sector-level allocation question may properly use sector-level data. A claim about firms within sectors needs evidence about firms within sectors.
When individual observations and group labels are available, inspect both the between-group pattern and the within-group variation. For repeated observations on the same entities, the Panel Data lesson develops within-entity estimation and its assumptions. It has a public preview; the full lesson requires membership. Within an entity over time is a distinct comparison from within a sector across firms, so choose the structure that matches the question.
When only aggregates are available, individual conclusions need additional information or explicit identifying assumptions. A hierarchical model cannot manufacture the missing observations; its cross-level conclusions depend on its assumptions. Freedman's ecological-inference discussion, §2 illustrates how a seemingly plausible aggregate regression can fail when subgroup behaviour varies with location.
Finally, resolving the aggregation problem does not establish causality. Confounding, selection and reverse causation may remain even in individual data. The four-point example demonstrates arithmetic only; it supplies no sampling model, significance test or causal design.
Sources
W. S. Robinson (1950), Ecological Correlations and the Behavior of Individuals, American Sociological Review 15(3), 351–357; definitions on p. 351 and the relationship between group margins and individual cell counts on pp. 353–354.
David A. Freedman, The Ecological Fallacy, author preprint dated 1 August 2002, subsequently listed by Berkeley for the 2004 Encyclopedia of Social Science Research Methods entry. Defines the cross-level error and distinguishes aggregation from confounding.
David A. Freedman, Ecological Inference and the Ecological Fallacy, Berkeley Technical Report 549, dated 30 October 1999, for the 2001 International Encyclopedia of the Social & Behavioral Sciences entry; introduction and §§1–2 on group correlations and the assumptions behind ecological regression.