DeepWalk learns node vectors from random-walk contexts. See how a three-node graph becomes a corpus, what the window changes, and where financial graph design matters.
DeepWalk
DeepWalk learns a vector for each graph node by training a Skip-gram model on short random walks. The walks turn network neighbourhoods into prediction examples: a node should help predict other nodes appearing nearby in a walk. For a quant, this provides graph-derived features that can join ordinary company or account attributes in a statistical model. Their financial meaning depends on the edges supplied to the algorithm. The original paper introduced the method for social-network representations.
From an edge list to a training corpus
For the standard unweighted walk, choose the next node uniformly from the current node's neighbours. Repeat short walks from nodes across the graph. Node IDs play the role of words; the collection of walks is the corpus. A window with radius w supplies context positions up to w steps before and after each centre position, excluding that position itself. The original DeepWalk trains these centre–context predictions using hierarchical softmax. Perozzi, Al-Rfou and Skiena, Sections 3–4.
Skip-gram learns representations useful for predicting surrounding tokens, rather than predicting only the next token. An abstract form of its objective is
θmax(v,u)∈D∑logpθ(u∣v),
where D is the collection of centre–context pairs with multiplicity, and θ includes the learned parameters. The prediction target is a node identity. Hierarchical softmax computes node probabilities through decisions in a binary tree; negative sampling is a different training objective often used in Skip-gram implementations. It should not silently be treated as the original DeepWalk specification. Mikolov et al., Section 2.
Three nodes, two different notions of proximity
Consider the undirected, unweighted path A–B–C, with no self-loops. Start the walk at B. There are two equally likely next nodes:
P(X1=A∣X0=B)=P(X1=C∣X0=B)=21.
From either endpoint, B is the only neighbour. Therefore
P(X2=B∣X0=B)=21×1+21×1=1.
This is a probability of returning after exactly two steps, not of staying at B. The multistep-transition lesson derives the general calculation (public preview; full lesson requires membership).
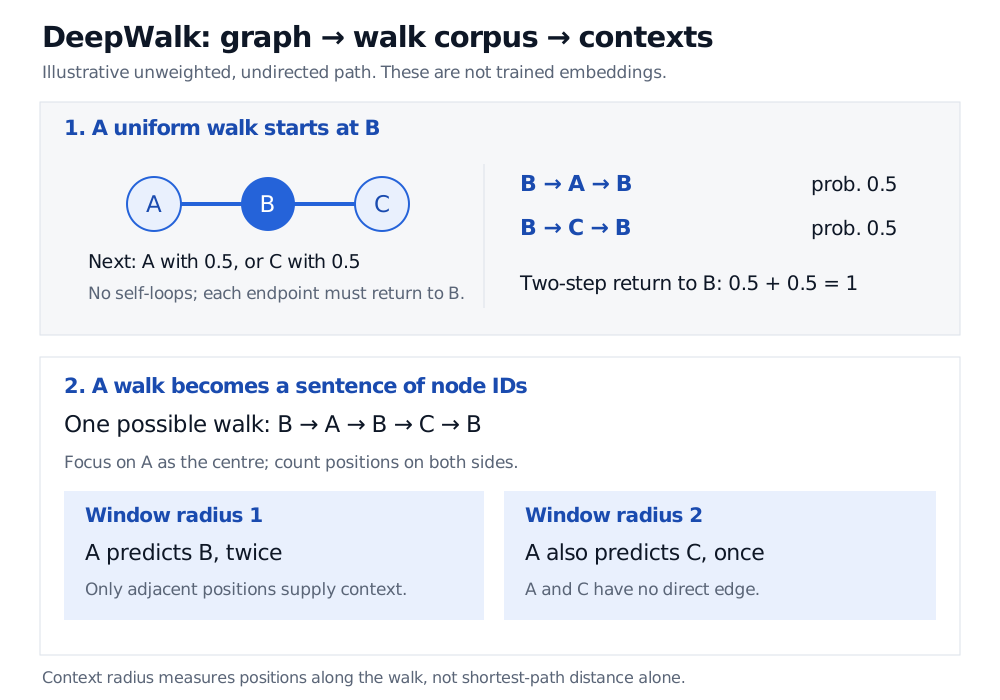
One possible walk is B, A, B, C, B. With radius 1, the A at the second position has B on both sides: the pair “A predicts B” occurs twice. With radius 2, C also enters A's context, although A–C is not an edge. Contexts measure separation along sampled walks; they need not be direct graph neighbours. Repeated visits can even place the same node identity at the centre and a different context position.
Illustrative path A–B–C: a walk from B reaches A or C with probability 0.5 each and returns to B after two steps with probability 1. In the example walk B–A–B–C–B, A has B twice as context at radius 1; radius 2 adds C once.
Walk probabilities generate a corpus; the context window decides which node pairs become training examples. No embedding coordinates are implied.
These probabilities and pairs do not determine a unique embedding. Walk sampling, window rules, vector dimension, initialisation and optimisation affect the fitted result. Even an equivalent rotation can change the coordinate values without changing dot products. No trained vectors have been inferred from this toy graph.
Before interpreting a financial embedding
Suppose nodes are companies and edges mean a disclosed supplier relationship. Nearby walk contexts then encode proximity in that supplier network. If edges instead connect stocks whose historical returns are correlated, the representation describes a different object. Combining supplier, ownership and correlation edges into one untyped graph discards those distinctions. A direction such as “supplies” also disappears if the graph is made undirected.
For a historical prediction exercise, construct each training graph using relationships known at the prediction date. A relationship's economic start date can precede its disclosure date; using the earlier date can import information unavailable to a trader. Estimate correlation edges only from the available past window, and respect the same cutoff when generating walks and fitting vectors. This applies the general data-leakage principle to graph construction. Unsupervised training can still leak future information.
A close pair of vectors is evidence of similarity under this graph and sampling design, not proof of causality, a profitable trade or a calibrated default probability. Validate the downstream task over time and compare against simpler graph features before attributing value to the embedding.
Node2vec changes the walk mechanism with biases that depend on the previous node, allowing different neighbourhood exploration. GraphSAGE instead learns a feature-and-neighbourhood aggregation function that can generate representations for unseen nodes with compatible attributes. Basic DeepWalk learns node-specific vectors; adding a new company does not automatically give it a vector from its financial attributes. See the authors' node2vec and GraphSAGE project explanations.