Consumer receipt panels follow purchases shared by participating shoppers. Distinguish cohort spending changes from panel growth, missing receipts and later revisions.
Consumer receipt panel
A consumer receipt panel is a group of participating shoppers whose purchases are observed over time through shared paper receipts, digital receipts or permissioned access to purchase emails. For a quant, it can reveal changes in baskets, repeat purchasing and spending across merchants. The central measurement problem is separating changes in shoppers' behaviour from changes in who, and what, the panel observes.
This is a form of alternative data, with a different collection boundary from credit-card transaction data. A receipt panel starts from receipts or purchase messages shared by participants; a payment panel starts from covered payment records. A receipt can contain item descriptions and quantities that a merchant-level payment record does not supply. Neither collection route guarantees a complete view of a person's spending.
For example, the Kilts Center's Numerator dataset description lists receipt-captured purchases across e-commerce and traditional channels, with fields including retailer, payment method, quantity, unit price and product description. Field availability is a property of the particular feed, rather than a universal receipt-panel schema.
The same shoppers, or a bigger panel?
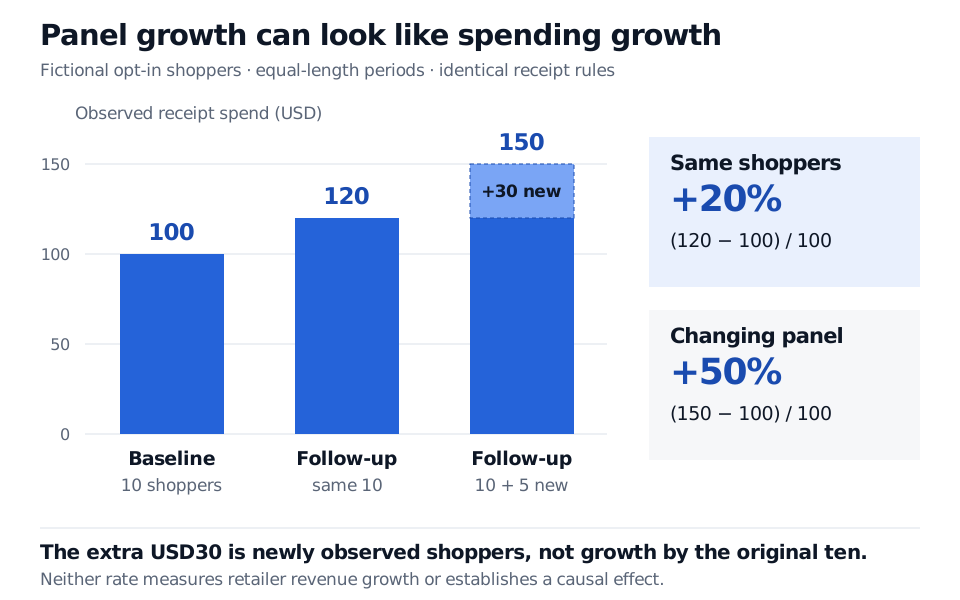
Consider a fictional retailer observed over two equal-length periods. Ten opt-in shoppers contribute USD100 of recorded spending in the baseline period and USD120 in the follow-up. All ten remain observable under the same receipt rules. Five newly joining shoppers contribute another USD30 in the follow-up; their baseline purchases are unobserved, not assumed to be zero.
The two calculations answer different questions:
Same-cohort growthPooled recorded growth=100120−100=20%,=100120+30−100=50%.
The original ten increased recorded spending by USD20. The extra USD30 comes from newly observed shoppers. Calling the pooled 50% a change in existing shoppers' spending confuses panel expansion with behaviour.
Fictional receipt spend in USD: the same ten shoppers spend 100 then 120, an increase of 20%. Five new shoppers add 30, giving pooled follow-up spend of 150 and a 50% increase against the original baseline.
Original fictional example. Equal-length periods and unchanged collection rules isolate the effect of adding shoppers; neither rate is retailer revenue growth or a causal estimate.
Even the 20% describes only the recorded spending of this cohort. It does not show that all customers spent 20% more, that the retailer's recognised revenue grew by 20%, or that a promotion caused the increase. Changes in prices, product mix, seasonality and unobserved purchases remain possible explanations.
A constant cohort helps diagnose coverage changes, but choosing only people who remain active through the end can introduce survivorship bias. Report the inclusion rule, join dates and dropout rates alongside the spend series. For historical forecasting, cohort eligibility must use information available at the decision date.
A panel has a collection boundary
The Amazon Shopper Panel provides a concrete opt-in example: participants share eligible paper or email receipts, can stop sharing, and can delete uploaded receipts. Its programme is invitation-only with limited participation. Those facts describe that programme, not every provider's recruitment or permission model, and do not establish that a particular panel represents a national population.
Selection bias can arise at several stages: who joins, which accounts they connect, which receipts they submit, and which records pass the provider's reporting screens. An absent receipt can mean no purchase, an unshared purchase, lost account access or failed extraction. Treating all four as zero spending changes the economic meaning of the series.
NPD's historical How Reliable Is Your Consumer Panel Data?, preserved in a 2021 ARF archive, describes burn-in periods, receipt-submission screens, duplicate cleaning and demographic balancing. It also acknowledges that behavioural skews can remain after demographic controls. These are examples of methodological choices to investigate, not current specifications for every receipt feed. Weighting to demographic totals does not, by itself, establish that missing purchases behave like observed purchases.
Before interpreting a merchant series, pin down three boundaries:
Boundary
Question that changes the measurement
Shopper and permission
Is the unit a person, household or connected inbox? Which purchase sources and downstream uses are covered by the participation terms? What happens after withdrawal or disconnection?
Merchant identity
Do receipt names, store banners, marketplace sellers and parent companies map consistently? Can a mapping correction reallocate old spending?
Purchase value
Does the amount include taxes, delivery charges and discounts? Are duplicate confirmations, cancellations, returns and refunds linked to the original order?
Returns deserve particular care. An order confirmation alone does not establish the final amount retained by a merchant. Shopify's sales-report documentation distinguishes sales from later reversals, including refunds, cancellations and order edits, and records reversals on their processing date. That is a merchant-platform convention, not a receipt vendor's promised coverage. Establish whether the panel captures those later messages and which date its net-spend measure uses before comparing it with reported sales.
Keep the purchase clock separate from the information clock
YipitData's email-receipt description says a joining user's historical purchases can be accessed as well as future purchases while the user remains in the panel. A receipt dated before enrolment can therefore enter a dataset later. It must not be treated as information a historical model already possessed.
Store the purchase date separately from receipt capture, vendor publication and the researcher's usable availability time. Preserve versions of merchant mappings, cohort rules and reported values. In its April 2025 panel-expansion announcement, Numerator explicitly described an expansion applied retroactively to earlier years. A newly expanded history can help current analysis while differing from the feed available at an earlier forecasting date.
A point-in-time dataset preserves that distinction. The Point-in-Time Data lesson develops availability cutoffs and version selection; its public preview is available, and the full lesson requires membership.
The useful output is a precisely labelled measure: recorded spend for a stated cohort, merchant mapping, value convention and historical data version. Connecting it to company revenue requires a separate reconciliation of customer coverage, channels, geography, returns and accounting scope. Connecting it to a causal claim requires an identification design beyond observing purchases.