The distinction from arbitrage pricing theory matters: APT supplies a pricing argument under its assumptions; it does not select this particular list of factors.
What the five inputs mean
The familiar specification uses these variables. Expectations below are conditional on information available at the indicated month-end.
| Symbol | Original construction |
|---|---|
| Monthly log growth in US industrial production: . | |
| Change in expected inflation: . | |
| Realised inflation less its prior expectation: . | |
| Return on a Baa-and-under corporate-bond portfolio minus long-term government-bond return. | |
| Long-term government-bond return minus the one-month Treasury-bill rate known at for month . |
A macro factor is therefore a measured series with a timing rule, not just a label such as “inflation”. Replacing the expectation model, bond portfolio or data vintage creates a different empirical implementation.
Exposures explain movements; prices of risk explain expected returns
Write a centred-input version of the return equation as
Here is a declared centred factor input, is its factor exposure, and is the asset-specific residual. A time-series regression estimates the loadings from repeated observations of the asset and the factors. Centring changes the intercept; it does not by itself turn an input into an unpredictable economic shock.
A separate cross-sectional pricing question is whether assets with different loadings have different expected returns:
The are prices of factor risk, not the realised and not the loadings . Estimating exposures is only the first step toward a Fama–MacBeth regression pricing test. A large loading or a good time-series fit alone does not establish a nonzero factor premium.
A fictional attribution calculation
| Input | Centred value (pp) | Loading | Return contribution (pp) |
|---|---|---|---|
| Production | 0.50 | 1.20 | +0.60 |
| Change in expected inflation | 0.20 | −0.50 | −0.10 |
| Unexpected inflation | −0.10 | 0.80 | −0.08 |
| Risk-premium spread | 0.30 | 0.60 | +0.18 |
| Term structure | 0.40 | −0.30 | −0.12 |
Multiplying each input by its loading gives a net factor contribution of
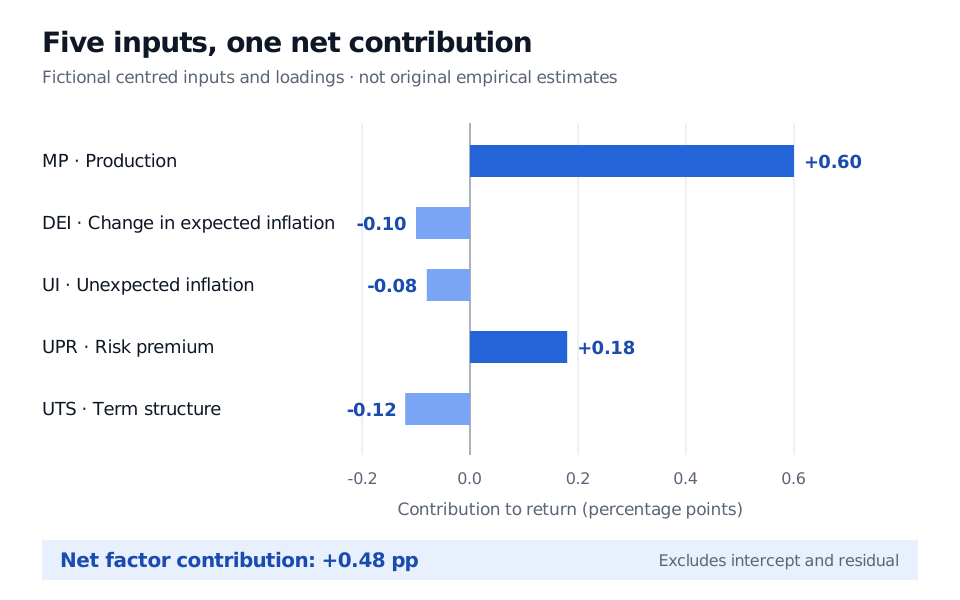
This is factor attribution under an assumed linear model. It is not the portfolio's complete return, an expected risk premium or a causal estimate. For example, the negative unexpected-inflation contribution follows from a positive loading multiplied by a negative input; it does not establish a universal rule about how stocks respond to inflation.
Loadings must accompany their units. Expressing the same inputs in smaller units requires inversely rescaling the loadings to preserve the fitted return. There is no fixed universal coefficient vector to copy into a trading system.
Using the specification carefully
For risk monitoring, document the factor definitions, observation frequency, release calendar, expectation model and estimation window before interpreting exposures. A historically aligned production series can be useful in a research test while being unavailable for a contemporaneous trading decision. Check what information actually existed at the decision time.
The model offers an interpretable research specification, not a guarantee that these variables price every asset universe or remain significant in a new sample. A new application needs its own estimation, uncertainty assessment and pricing tests.
Sources
- Chen, N.-F., Roll, R. and Ross, S. A. (1986). Economic Forces and the Stock Market, The Journal of Business, 59(3), 383–403. §III and Table 1 define the inputs; §IV.A distinguishes estimated exposures from the subsequent pricing test. Publisher DOI.