The Beveridge curve is the usually downward-sloping relationship between the unemployment rate on the horizontal axis and the job openings rate on the vertical axis. It helps macro analysts assess whether labour demand is cooling through fewer vacancies, or whether that cooling is also showing up in higher unemployment. Each month supplies a point. The curve describes the relationship across points. BLS Beveridge curve, chart 4
Two rates, two denominators
Suppose a fictional labour market has 1,000 people in the labour force, of whom 60 are unemployed and 940 are employed. Employers report 40 vacant jobs. Assume one filled job per employed person and the same coverage for filled and vacant jobs, giving 980 positions in total.
This gives point A in the chart. The first rate is a share of people in the labour force. The second is a share of filled and vacant positions. In US releases, the Current Population Survey (CPS) measures unemployment through households, usually for the week containing the 12th. The Job Openings and Labour Turnover Survey (JOLTS) measures nonfarm establishments' vacancies on the last business day of the month. Use the establishment employment measure in the vacancy-rate denominator. The shared count of 940 works here because of the example's assumptions. BLS CPS definitions · BLS JOLTS overview · BLS JOLTS calculation
A move along the curve or a shift?
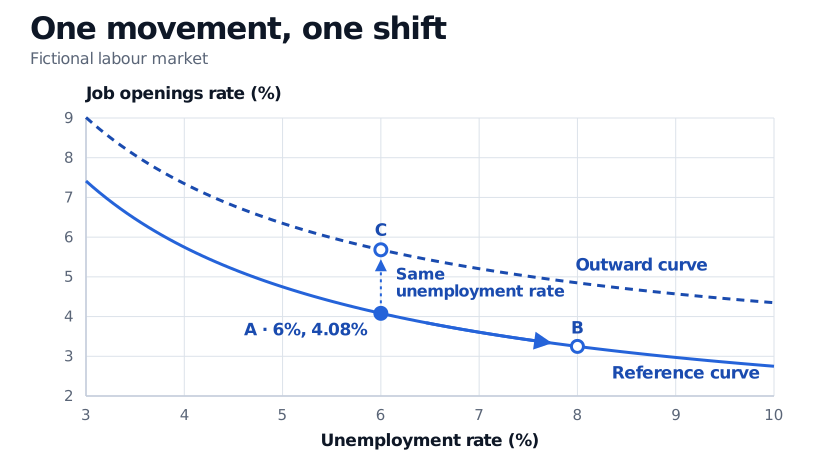
The solid curve contains the worked point A and the cooling scenario B. The dashed curve illustrates an outward shift. Both curves are fictional.
A to B is a movement along the reference curve. As demand weakens, firms typically post fewer openings and unemployed workers have fewer opportunities to find jobs. If matching conditions and the rate at which workers become unemployed stay similar, the economy can move down and right along the same curve. In a steep part of the curve, a large drop in openings can coincide with a small rise in unemployment. Figura and Waller, Federal Reserve
A and C compare two curves at the same unemployment rate. C has more openings at that unemployment rate. An outward shift can occur when available jobs and jobseekers are harder to match, for example because they are in different regions or require different skills. Higher flows from employment into unemployment can also shift the curve out. And if vacancies and unemployment adjust at different speeds after a shock, the monthly points can temporarily trace a loop. Figura and Waller, Federal Reserve · Ahn and Crane, Federal Reserve
A point above the old curve raises a question about what changed. To assess a mismatch hypothesis, examine openings by industry and region and check whether unemployed workers are finding jobs more slowly. Look at layoffs and worker transitions too. Monthly hires include people who switched jobs, and the month-end openings count can fall because firms filled or withdrew positions. The plot alone cannot identify the mechanism or tell you how unemployment would respond to a policy change. BLS JOLTS FAQ · Ahn and Crane, Federal Reserve
Sources
- US Bureau of Labor Statistics, JOLTS charts, chart 4
- US Bureau of Labor Statistics, CPS Concepts and Definitions
- US Bureau of Labor Statistics, JOLTS overview
- US Bureau of Labor Statistics, JOLTS Handbook of Methods, Calculation
- US Bureau of Labor Statistics, JOLTS Frequently Asked Questions
- Figura and Waller (2022), What does the Beveridge curve tell us about the likelihood of a soft landing?
- Ahn and Crane (2020), Dynamic Beveridge Curve Accounting