The Altman Z-score is a weighted sum of five financial ratios used to screen publicly traded manufacturers for bankruptcy risk. Edward Altman fitted the weights to separate bankrupt from non-bankrupt firms. A lower score signals greater financial distress and can help a credit analyst decide which issuers to investigate first. Altman (1968), §§ II–III and V.
What goes into the score
Altman’s 2002 paper gives this rounded version of the public-manufacturer formula. Enter each ratio as a decimal, so 10% enters as 0.10. Altman (2002), Figure 2.
| Input | How to calculate it | Fictional manufacturer |
|---|---|---|
| (Current assets − current liabilities) ÷ total assets | 0.10 | |
| Retained earnings ÷ total assets | 0.20 | |
| Earnings before interest and taxes (EBIT) ÷ total assets | 0.08 | |
| Market value of equity ÷ book value of total liabilities | 1.20 | |
| Net sales ÷ total assets | 1.50 |
For , Altman’s 2002 discussion specifies tangible assets as the denominator. Assume the fictional manufacturer has no intangible assets, so both denominators give the same ratio. For , include common and preferred equity at market value and both current and long-term liabilities at book value. A falling share price can lower this ratio between financial reports even when the reported accounts stay the same. Altman (2002), discussion following Figure 2.
The fictional manufacturer scores . The 1968 equation instead uses the first four inputs as percentage-point values (10, 20, 8 and 120) with weights 0.012, 0.014, 0.033 and 0.006. Its sales input stays at 1.50 with a weight of 0.999, giving 2.8825 for the same firm. Altman (1968), equation I and Table 1.
The gray zone and the classification cutoff
In Altman’s original sample, scores below 1.81 belonged to firms that went bankrupt and scores above 2.99 belonged to firms that did not. Both groups appeared in the gray zone from 1.81 through 2.99. For a single binary classification, Altman separately chose 2.675 to minimise misclassifications in that sample. The two rules answer different questions. Altman (1968), § V, Tables 6–7.
Suppose the fictional manufacturer’s market equity falls so that drops from 1.20 to 0.80 while the other ratios stay fixed. The rounded score falls by to 2.644. That crosses the historical binary cutoff. Both scores still sit inside the historical overlap.
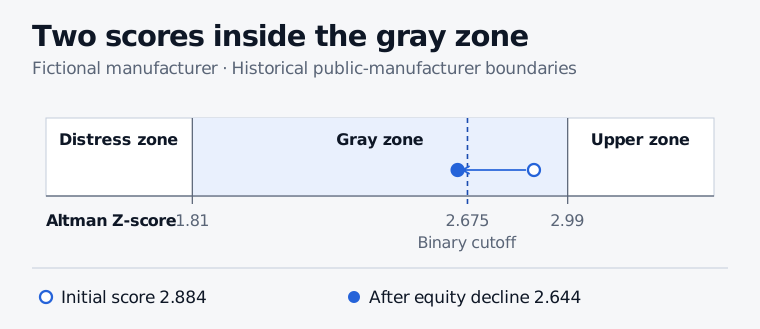
The same change in market equity flips the binary classification while leaving the score in the gray zone.
Using the score beyond the original sample
The score ranks issuers by modelled distress. To estimate a one-year probability of default, define the event, estimate a mapping from scores to subsequent event frequencies in a relevant borrower population, and test that mapping on later outcomes. Bankruptcy filings and missed payments can produce different event frequencies. The SelfMadeQuant lesson on Probability calibration shows how to check whether predicted probabilities match outcomes in held-out data. The full lesson requires membership. Altman (2002), § 8.
Altman refitted the weights for private manufacturers in using book equity in place of market equity. His revision for broader sector coverage also removes sales to assets, a ratio that varies substantially across industries. Each version has its own scale and cutoffs. Altman (2002), §§ 6–7 and 9.
Sources
- Edward I. Altman (1968), Financial Ratios, Discriminant Analysis and the Prediction of Corporate Bankruptcy, The Journal of Finance, 23(4), 589–609.
- Edward I. Altman (2002), Corporate Distress Prediction Models in a Turbulent Economic and Basel II Environment, NYU Salomon Center.