The Pezier–White adjusted Sharpe ratio adds skewness and excess-kurtosis terms. Calculate it with consistent horizons and distinguish other Sharpe adjustments.
Adjusted Sharpe ratio
An adjusted Sharpe ratio is a higher-moment modification of the Sharpe ratio that incorporates return skewness and kurtosis. In the Pézier–White form used here, negative skewness and positive excess kurtosis reduce a positive Sharpe ratio, so two strategies with identical mean excess return and volatility can receive different scores.
The name alone is insufficient: “adjusted” can refer to several different corrections. Specify the equation, moment definitions and return horizon alongside the number.
Three moments beyond the mean
Let X=R−Rf be an investment's excess return over a matching cash benchmark for one stated horizon, with mean μ and standard deviation σ>0. Assume a finite fourth moment. Define
SR=σμ,S=σ3E[(X−μ)3],K=σ4E[(X−μ)4].
Skewness S describes asymmetry. Kurtosis K here is Pearson kurtosis, with a normal-distribution benchmark of 3. Excess kurtosis is K−3, with a normal benchmark of zero. This distinction changes the calculation, not just its label.
The adjustment is
ASR=SR[1+6SSR−24K−3SR2]=SR+6SSR2−24K−3SR3.
Pézier and White (2006), equation (7), present this expression through a truncated Taylor expansion of expected exponential utility. It is an approximation motivated by preferences over higher moments, not an exact utility score for every distribution or investor. Setting S=0 and K=3 recovers ordinary Sharpe; that equality does not prove the distribution is normal.
For positive SR, negative S lowers the score through the squared-Sharpe term, and positive K−3 lowers it through the cubed-Sharpe term. The wording “penalty” needs that sign context: with a negative Sharpe, the kurtosis contribution changes sign. Do not extrapolate the usual positive-Sharpe ranking intuition to losing strategies.
The same Sharpe, with a different shape
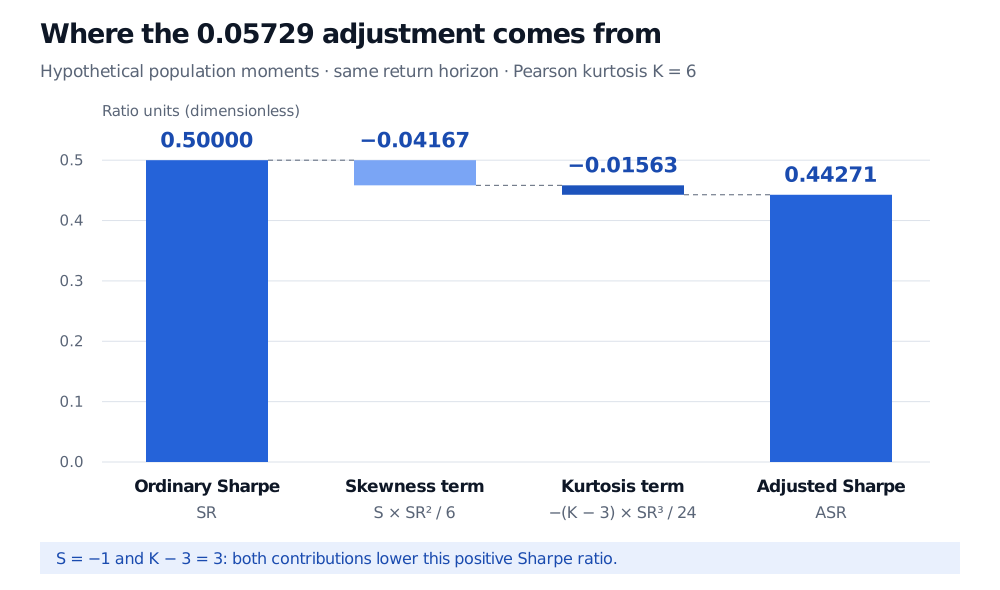
Consider stipulated population moments of one-year excess returns, rather than estimates from a short backtest. The ordinary annual Sharpe is 0.5, skewness is −1 and Pearson kurtosis is 6, so excess kurtosis is 3.
The score falls by approximately 0.05729 ratio units, not by 5.729 percentage points of investment return. A comparison distribution with the same Sharpe and moments S=0, K=3 would retain a score of 0.5. The adjustment distinguishes these stipulated shapes without identifying their crash probabilities.
Hypothetical same-horizon population moments: ordinary Sharpe 0.50000, skewness contribution minus 0.04167, excess-kurtosis contribution minus 0.01563, and adjusted Sharpe 0.44271. Skewness is minus 1 and Pearson kurtosis is 6.
Original same-horizon population calculation. Floating bars isolate the skewness and excess-kurtosis contributions; all vertical values are dimensionless ratio units.
If a data provider instead reports excess kurtosis of 3, use that 3 directly in the excess-kurtosis term. Subtracting 3 again would erase this example's entire kurtosis adjustment.
A yearly label does not align the inputs
Compute the mean, volatility, skewness and kurtosis from the same return definition and horizon. With a constant cash return, centring removes the constant, so total-return and excess-return central moments coincide. With varying cash returns, calculate the moments of the excess-return series itself. Align dates, currency, costs and missing observations before comparing strategies.
There is a particular implementation trap. PerformanceAnalytics' documented AdjustedSharpeRatio describes an annualised Sharpe. Its maintainer source calls SharpeRatio.annualized while calculating skewness and moment kurtosis from the supplied return observations. Monthly observations therefore do not automatically produce the same-horizon annual-moment quantity defined above. Record that software convention if reproducing its output.
To see why the distinction matters, suppose q excess returns are independent and identically distributed, with finite fourth moment. For their additive sum, the population quantities satisfy
SRq=qSR1,Sq=qS1,Kq−3=qK1−3.
Substitution gives ASRq=qASR1. This algebra requires all three transformations together; annualising only SR while retaining one-period S and K defines a different convention. The identity concerns sums, not compounded simple-return wealth, and independence supplies the higher-moment aggregation rules. Zero autocorrelation alone is insufficient for those higher-moment rules.
Which adjustment answers the question?
Measure or convention
What changes?
What it does not establish
Pézier–White higher-moment adjustment
Adds skewness and excess-kurtosis terms to Sharpe
Statistical significance or protection against unobserved losses
Includes serial covariance when aggregating returns across time
A preference-based penalty for skewness or kurtosis
Modified Sharpe using Cornish–Fisher VaR
Replaces standard deviation with a specified tail-risk denominator
Equivalence to this polynomial adjustment
Deflated Sharpe ratio
Evaluates evidence against a benchmark that reflects selection among trials
An interchangeable higher-moment performance score
The PerformanceAnalytics methods documentation explicitly distinguishes standard-deviation, VaR and expected-shortfall denominators. Bailey and López de Prado's deflated-Sharpe paper addresses multiple testing, sample length and non-normality. A higher-moment score contains neither sample length nor the number of strategies searched; it cannot perform that inference by itself.
A useful diagnostic, with fragile inputs
Historical skewness and kurtosis are estimates that can be dominated by a few extreme observations. A short record missing the adverse state can make both ordinary and adjusted Sharpe flattering. If the fourth population moment does not exist, the population formula above is unavailable even though finite-sample software may print a number.
Four moments do not determine a distribution's tail probabilities, drawdown path or liquidity during stress. Large correction terms also weaken the case for treating a truncated expansion as a faithful utility approximation. Report ordinary Sharpe, both higher moments and their separate contributions, and inspect the underlying returns. An adjusted score is not a robust tail-risk guarantee or a substitute for scenario analysis.
For the portfolio context behind the starting ratio, Risk-Adjusted Performance Measures compares total-volatility, beta and active-risk measures, and discusses asymmetric option payoffs. A public preview is available; the full lesson requires membership.