Read cumulative gain and lift as capture versus review capacity, distinguish their denominators from precision, and evaluate a fictional twenty-case ranking.
Lift and gain chart
A lift and gain chart evaluates a binary-outcome ranking by asking how many positive cases sit near the top. The cumulative gain chart shows the fraction of all positives captured as the selection expands; the cumulative lift chart expresses that capture relative to random selection. For a quant team with limited capacity to investigate suspicious transactions, these charts connect a model's ordering to the size of the review queue.
Here, “positive” means the event being sought, not necessarily a financially desirable outcome. A fraud label is positive even though fraud is undesirable. The convention throughout is cumulative: the top ten cases include the top five. Some software also displays response rates for separate score buckets, so check the definition before comparing charts. Alteryx's documentation distinguishes cumulative capture from the response rate within each decile.
The denominators do different jobs
Rank N equally weighted cases from highest to lowest score. Let P>0 be the total number of actual positives and Hk the positives among the top k cases. For 1≤k≤N, define
xk=Nk,Gk=PHk,Lk=xkGk=P/NHk/k.
The horizontal axis is the fraction selected, xk. Cumulative gain Gk is recall when the top k cases are flagged. Cumulative lift Lk is precision at k, Hk/k, divided by the sample's positive prevalence, P/N.
Gain answers “what share of all positives did we capture?” Precision answers “what share of our selections were positive?” A precision-recall curve uses those two rates as its axes, whereas a gains chart places workload on the horizontal axis. See scikit-learn's binary metric definitions for the underlying precision and recall denominators.
For uniform random selection of k cases, expected capture is k/N: the gain baseline is the diagonal, and the lift baseline is one. These are expectations; a particular random selection can land above or below them. Gain begins at zero and finishes at one; lift is undefined at zero selections and finishes at one. This cumulative convention follows IBM's gain and lift definitions.
Twenty cases, five confirmed events
Consider a fictional set of twenty transactions ranked at the decision time. A positive is fraud confirmed within the following thirty calendar days; every case has completed that observation window. The predeclared scores have no ties. Only ranks 1, 3, 4, 8 and 20 are positive. These stipulated labels illustrate the arithmetic, not the performance of a fitted fraud model.
Selection
Positive cases captured
Precision
Cumulative gain
Cumulative lift
Top 5: 25% of cases
3 of 5
3/5=60%
3/5=60%
0.60/0.25=2.4
Top 10: 50% of cases
4 of 5
4/10=40%
4/5=80%
0.80/0.50=1.6
All 20: 100% of cases
5 of 5
5/20=25%
5/5=100%
1
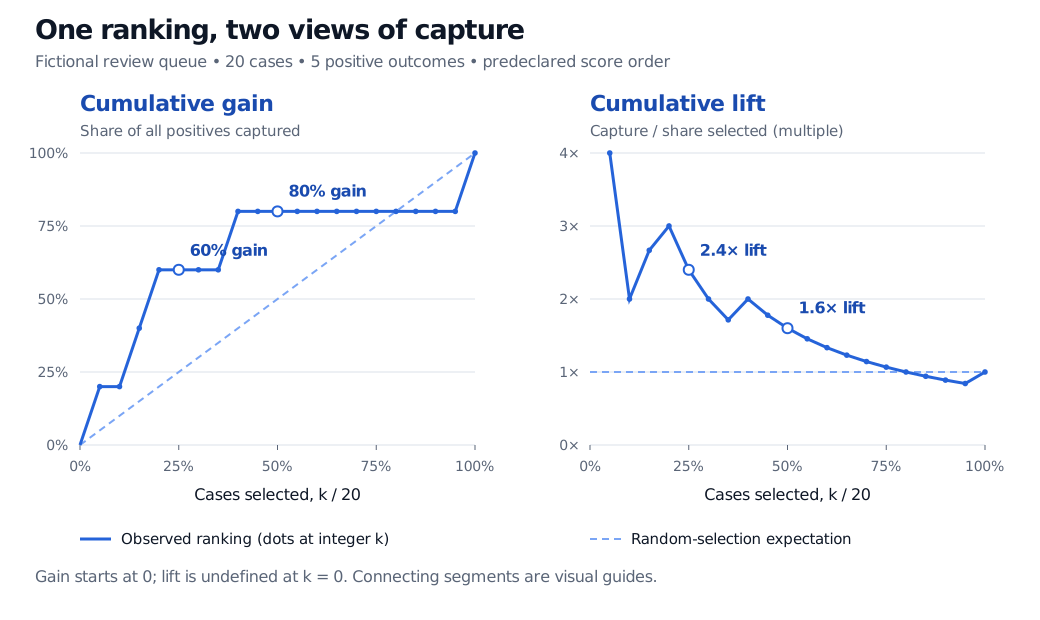
At five reviews, the selected group has 2.4 times the positive rate of the whole sample. Equivalently, it captures 60% of events using 25% of review slots. The 60% precision and 60% gain coincide here because both denominators happen to be five. At ten reviews they separate clearly: precision is 40%, gain is 80%.
Two cumulative charts of a fictional twenty-case ranking with five positives: selecting 25% captures 60%, lift 2.4; selecting 50% captures 80%, lift 1.6. Gain ends at 100% and lift ends at one.
Figure: The same observed ranking expressed as cumulative gain and cumulative lift. Dots represent integer queue sizes; connecting segments guide the eye. Dashed lines show random-selection expectations.
Gain cannot fall as more cases enter. Lift can rise or fall: adding a positive may raise the selected group's positive rate, while adding a negative lowers it. A smooth, steadily declining lift curve is not a mathematical requirement.
From capture to a decision
Expanding this queue from five to ten reviews finds one additional positive in five additional cases: the added group's positive rate is 20%. The cumulative lift of 1.6 describes all ten selections; it does not describe those five extra reviews. Whether expansion pays depends on investigation cost, the losses associated with missed events, recoverability and delays. A count chart treats a small fraud and a large fraud equally and does not establish profit.
Keep the evaluation contract explicit:
Freeze ranking and capacity choices before the final test. Use out-of-sample evaluation, with only information available at scoring time. Selecting a favourable cutoff after inspecting final-test outcomes overstates evidence; see scikit-learn's leakage guidance.
Fix the label and horizon. Unresolved investigations are not confirmed negatives. A thirty-day label and a one-year label define different evaluation tasks.
Declare tie handling. At a tied cutoff, select the entire tied group or use an outcome-blind tie-breaking rule fixed in advance. Report the resulting selected fraction; never put known positives first within a tie.
Report prevalence and cohort. Class imbalance, resampling and population change affect interpretation. The equations above use the same evaluation sample throughout; oversampled class proportions need population-aware correction before an operational interpretation. Alteryx explicitly identifies this issue in its true response rate setting.
Finally, predictive lift is not an incremental causal effect. Ranking likely fraud does not estimate how much fraud an intervention prevents. That requires a treatment-effect question and a design that identifies the effect of intervening, as explained in EconML's treatment-effect motivation. Better capture alone establishes neither prevention nor trading profitability.
For the classifier vocabulary behind these charts, the SelfMadeQuant lesson Evaluating Classifiers: Precision, Recall, and ROC/AUC develops confusion matrices and threshold trade-offs. The public page previews the lesson; the full teaching requires membership.