A credit scorecard combines borrower characteristics into a score that orders borrowers by assessed credit risk. An internal rating model is a lender’s method for assigning borrowers to risk grades. A scorecard can feed that assignment, and a separate calibration can attach a probability of default (PD) to each grade. The grade helps a lender prioritise credit reviews. The PD gives a quantitative input to expected loss estimates used in loan pricing and portfolio monitoring. Basel Framework, CRE36.9–36.14, 36.20 and 36.60.
From borrower data to a grade
A corporate scorecard might assign points for leverage, cash flow relative to debt service, and qualitative factors such as customer concentration or management quality. The total determines a provisional grade under the lender’s criteria. An analyst may adjust the grade when material information falls outside the model, such as the recent loss of a major customer. Two lenders can grade the same borrower differently because their inputs, definitions and scales differ. A public agency credit rating can be one input to this process. Basel Framework, CRE36.25–36.26, 36.33 and 36.44.
What a 5% or 10% PD means
Suppose a fictional lender assigns one-year PDs of 5% to Grade 1 and 10% to Grade 2. In a logistic model, the linear predictor is the natural log of the default odds. The assigned PDs in this example have the following implied log odds. Stanford CS229 lecture notes, §2.1.
Grade 2 has twice the assigned probability and times the assigned odds. The log odds above are transformations of the PDs. An institution’s point score may have its own units and may even run in the opposite direction, with higher points indicating lower risk.
Test the ranking and the probabilities separately
Suppose the lender calibrated those PDs on historical data available through December 2024 and froze the mapping before rating a new cohort on 1 January 2025. The model targets each initially performing borrower’s first default over the next 12 months, using the same event definition throughout. By the end of follow-up on 1 January 2026, 8 of 100 Grade 1 borrowers and 16 of 100 Grade 2 borrowers have defaulted. The lender groups them by their starting grade, even if their grades changed during the year.
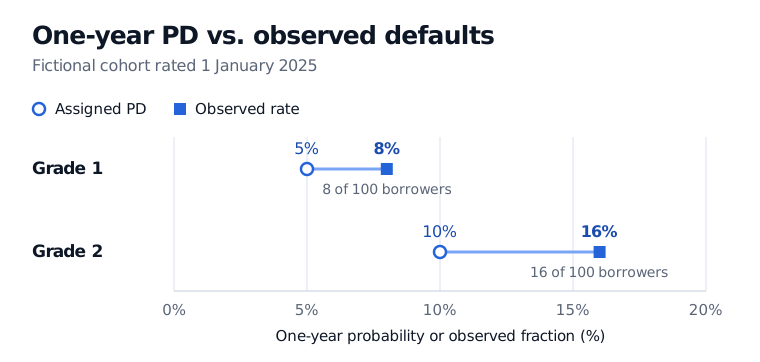
The higher-risk grade has the higher observed rate. The assigned probabilities are lower than the observed rates in both grades.
Discrimination asks how well the score or grade ranks borrowers who go on to default against those who do not. A measure such as ROC AUC uses that ordering. Calibration asks whether assigned probabilities agree with frequencies over comparable groups and horizons. Here the ordering goes in the expected direction, but the PDs underpredict defaults in this cohort. Raising both PDs while preserving their order leaves the grade-based ROC AUC unchanged. One vintage gives limited evidence of a persistent error, especially when borrowers share exposure to an economic downturn. Compare several later vintages with completed follow-up and keep the default definition, observation window and model version attached to each result. BCBS validation study, §III.
The SelfMadeQuant lesson Probability calibration shows how to compare predicted probabilities with outcome frequencies on held-out data. A public preview is available. The full lesson requires membership.